
AskCSV
AskCSV is a data analysis tool that simplifies analyzing and visualizing data stored in CSV files.
Introduction
AskCSV is a data analysis tool that simplifies the process of analyzing and visualizing data stored in CSV files. It utilizes AI technology to provide users with valuable insights and allows them to ask questions directly to the CSV files.
Key Features
AI-powered data analysis
Data visualization tools
CSV import and analysis
Insights and business intelligence
Charts and tables generation
Data privacy and security
Frequently Asked Questions
What is AskCSV?
How to use AskCSV?
Is my data safe with AskCSV?
How does AskCSV's AI technology work?
Can I use AskCSV for large datasets?
Does AskCSV support data visualization?
Similar Tools

Storydoc
Elevate your presentations with our dynamic tool for interactive slide decks that engage your audience like never before.

Edraw Software
A versatile set of tools designed to help you create a wide range of diagrams and visual representations for your projects and presentations.
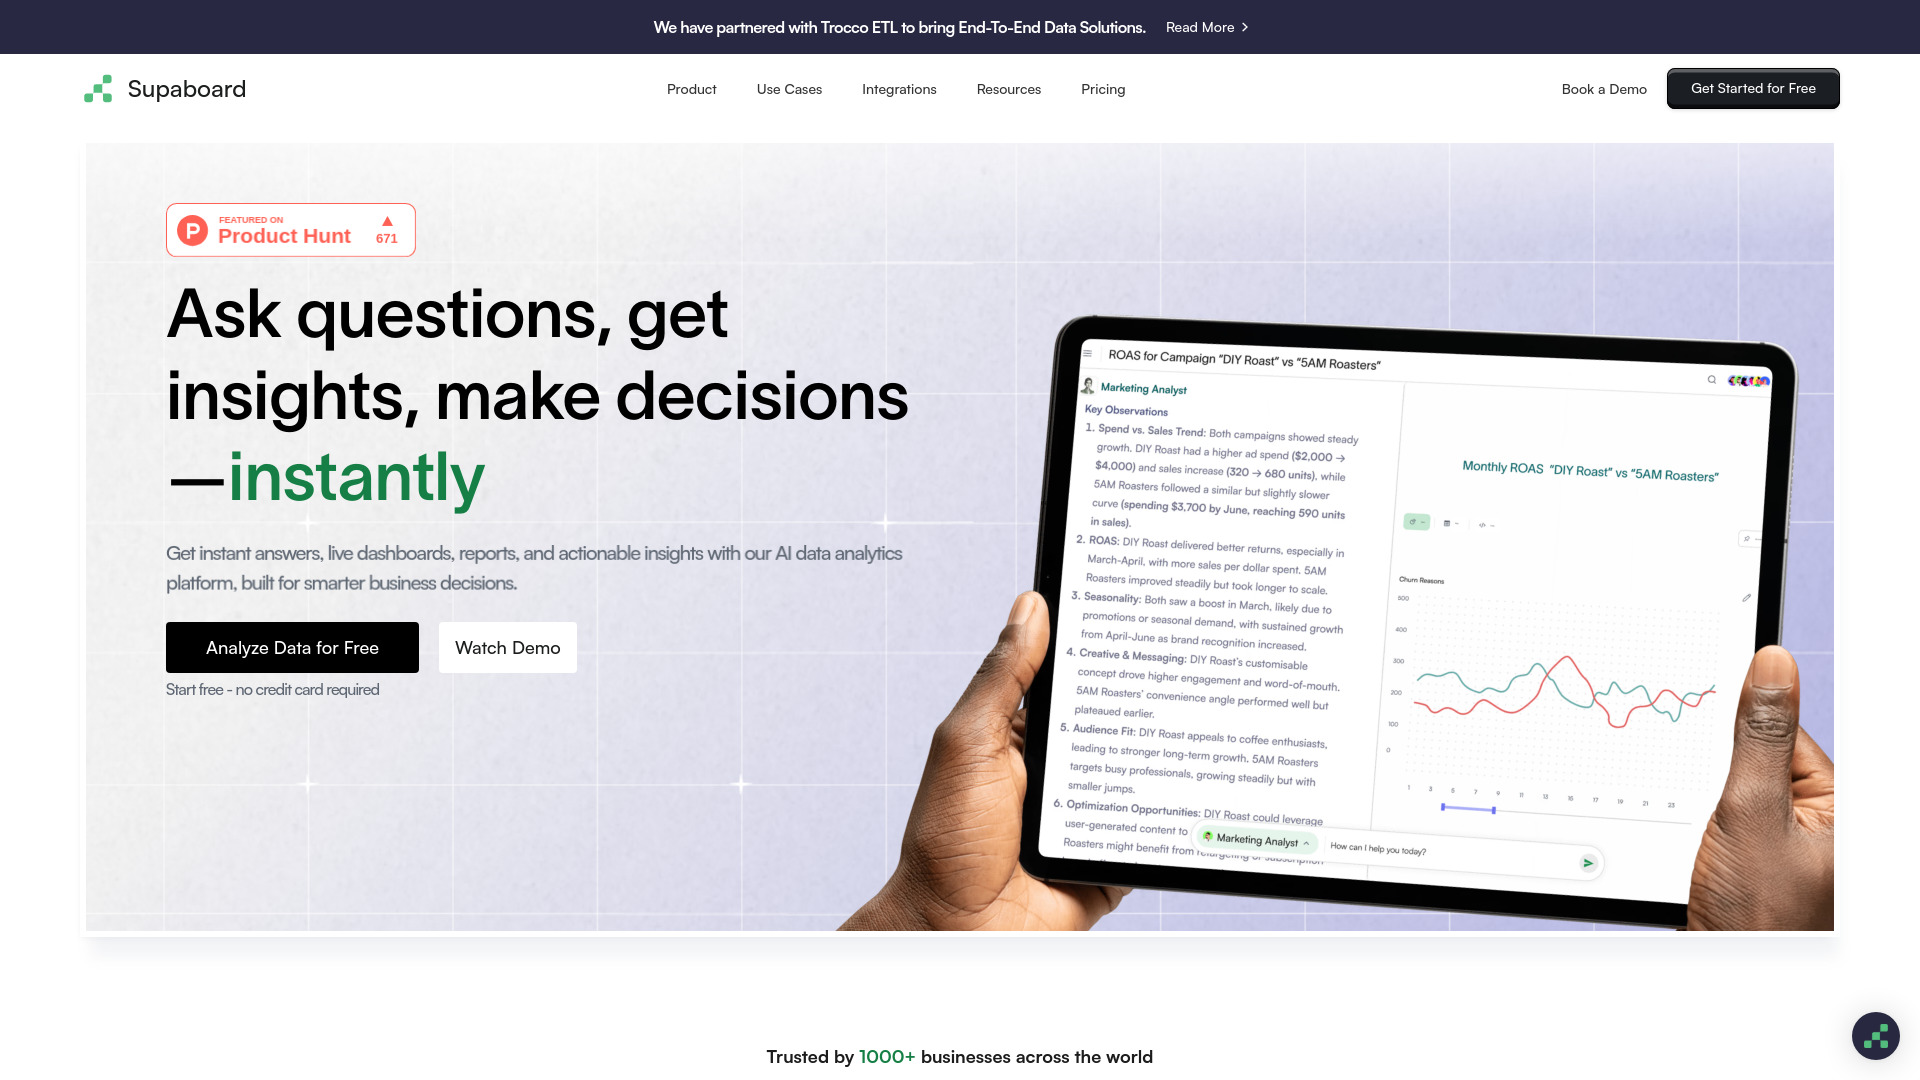
Supaboard
Revolutionary BI tool powered by AI to craft insightful dashboards and analytics from your data. Unlock new perspectives with this innovative solution.
Use Cases
- Analyzing sales data and identifying top-selling products
- Finding patterns and relationships in consumer behavior
- Comparing marketing campaign performance and ROI
- Identifying products frequently bought together
- Exploring similarities between data points
- Generating visualizations for data presentation
How to Use
To use AskCSV, simply login to the platform and select a CSV file to analyze. The tool will process the data within the file and present various charts, tables, and insights based on the user's queries. Users can ask questions by typing in natural language and receive relevant visualizations and data analysis results.